A00-470 is the SAS Visual Analytics Using SAS Viya exam, the credential SAS lists under Visual Analytics as its Visual Business Analytics Specialist. Fifty to fifty-five questions, one hundred minutes, sixty-seven percent to pass, $180 through Pearson VUE. What decides preparation is not the length but the shape: one content area, Use Objects and Build Reports, is worth 54 to 60 percent of the whole SAS Visual Analytics exam. Data preparation takes 32 to 36 percent, and everything about viewing, sharing and managing finished reports is squeezed into 8 to 10. That is a paper about building things. It rewards the person who has dragged a dual-axis chart onto a page and fought with its data roles, and it barely rewards the person who has read about doing so. This article walks through the three content areas, the report objects named in the objectives, how deep the data half really goes, what the exam costs, and how it differs from the Visual Statistics credential it is often confused with.
What Does the SAS Visual Analytics Exam Test?
A00-470 tests whether you can take data into SAS Visual Analytics on SAS Viya, shape it into usable data items, and build a report that answers a question. It has three content areas: data sources and data items, using objects and building reports, and viewing, sharing and managing reports. The middle one dominates.
“Now everyone can easily discover and share powerful insights that inspire action with a single application for reporting, data exploration and analytics.”
Those three activities in SAS’s own sentence, reporting, exploration and analytics, line up almost exactly with the exam’s three areas. The credential is not testing SAS programming, and it is not testing statistics. It is testing the application.
SAS lists it under Visual Analytics as the Visual Business Analytics Specialist, which is why search results and study material use two names for the same thing. If you are looking at both and wondering whether you have found two credentials, you have not.
What Are the Three A00-470 Content Areas?
The three areas are weighted 32 to 36 percent, 54 to 60 percent and 8 to 10 percent. Data Sources and Data Items covers importing and shaping data. Use Objects and Build Reports covers everything you place on a page. View, Share and Manage Reports covers what happens once the report is finished, and it is deliberately small.
| Content area | Weight | What it covers |
|---|---|---|
| Data Sources and Data Items | 32-36% | Importing local files, working with multiple sources, mappings, views, joins and aggregated sources, creating and modifying data items, hierarchies, calculations and parameters, and subsetting through sorts, filters and ranks |
| Use Objects and Build Reports | 54-60% | Automatic features, charts and templates, data roles and styles, list tables and crosstabs, descriptive, relationship and time series charts, geographic objects, custom graphs, page and container layout, and actions, alerts and prompts |
| View, Share and Manage Reports | 8-10% | Viewing in a browser, progressive web app, mobile and custom applications, exporting and distributing, and saving, localising and managing report configurations |
Notice that the weightings are ranges rather than fixed percentages. That is normal for SAS and it has a practical consequence: the boundaries move slightly between exam forms, so treating 54 percent as a floor rather than 60 as a ceiling is the safer reading of the middle area.
Which Report Objects Does the Exam Expect You to Build?
Specific ones, named individually in the objectives. List tables and crosstabs with display rules and sparklines. Descriptive, relationship and time series charts. Bar, dual-axis, part-to-whole, KPI and time variant charts. Geographic objects and analytic visualisations. And custom graphs built from the available layouts.
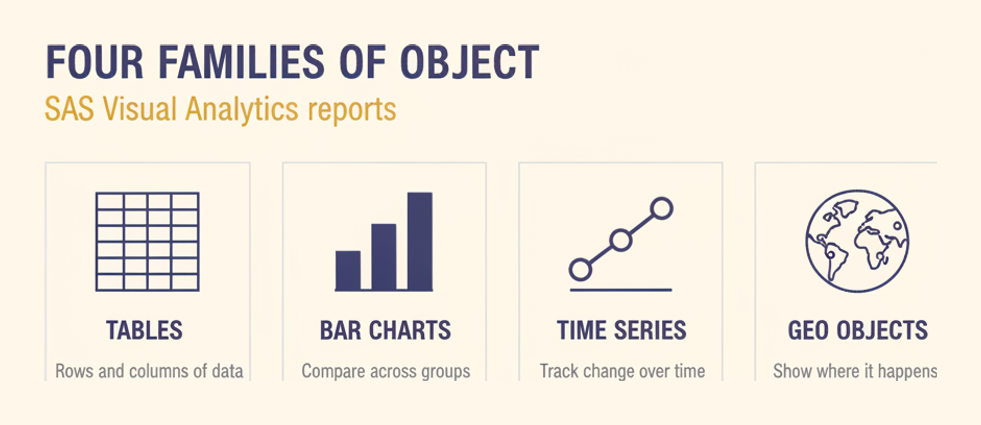
That list is unusually concrete for a certification blueprint, and it should be read as a checklist rather than as a summary. A candidate who has built six of those object types and never touched the other four is carrying a real gap into the largest area of the paper.
Data roles are where the marks quietly sit
Applying data roles is listed alongside creating the objects themselves, and it is the step that separates a chart that renders from a chart that answers something. A dual-axis chart with the wrong measure on the wrong axis is technically a completed object and analytically useless, and the exam asks about exactly that distinction.
- List tables and crosstabs, including display rules and sparklines
- Descriptive, relationship and time series chart families
- Bar, dual-axis, part-to-whole, KPI and time variant charts
- Geographic objects and analytic visualisations
- Custom graphs assembled from available layouts
Layout is the other half of this area. Pages, layouts, containers and content are named explicitly, and so are actions, filters, ranks, alerts and prompts. Those interaction features are what turn a set of charts into a report, and they are where a self-taught builder is most likely to have gaps. Background on the wider discipline sits in this overview of data visualisation principles if the vocabulary is new.
How Deep Does the Data Preparation Half Go?
Deeper than the phrase “data sources” suggests. At 32 to 36 percent, this area asks you to import xlsx and csv files, work across multiple sources with mappings, views, joins and aggregated sources, and then create and modify data items including properties, hierarchies, categories, calculations and parameters.
Parameters are the objective candidates most often underestimate. A parameter lets a single report respond to a user’s choice rather than being rebuilt for each variation, and the syllabus names numeric, character, date and expression-based parameters separately, which implies questions can distinguish between them.
Subsetting is a named skill, not an afterthought
Custom sorts, filters, ranks and common filters all appear in the objectives. A common filter is the one worth rehearsing, because it applies across objects rather than to a single one, and knowing when a filter should be common rather than local is a design decision the exam can test directly.
Hierarchies deserve the same attention. They drive drill-down behaviour, and a report whose hierarchy is built in the wrong order gives users a path they cannot use. That is the kind of practical consequence this area keeps returning to.
What Does A00-470 Cost and What Is the Pass Mark?
The exam costs $180, runs for 100 minutes and contains 50 to 55 questions, with a pass mark of 67 percent. It is delivered through Pearson VUE. At roughly two minutes a question the pacing is comfortable, which matters because scenario questions that describe a report take longer to read than they do to answer.
| Item | Detail |
|---|---|
| Exam code | A00-470 |
| Questions | 50 to 55 |
| Duration | 100 minutes |
| Passing score | 67 percent |
| Fee | $180 USD |
| Delivery | Pearson VUE |
A 67 percent bar on a 55-question form means roughly eighteen wrong answers is the limit. Given that the largest area could supply more than thirty of those questions, weakness in object building is very hard to compensate for elsewhere, however strong your data preparation is.
SAS publishes its full credential list on the SAS certification index, which is also where the Visual Business Analytics naming can be confirmed.
Is This the Same as the Visual Statistics Exam?
No. SAS runs a separate Modeling Using SAS Visual Statistics credential, and the two are commonly confused because both sit under the Visual Analytics heading and both run on SAS Viya. A00-470 is about building reports from data. The Visual Statistics exam is about building statistical models.
The practical test is what your output is. If the thing you hand over is a report that someone reads and filters, this is your exam. If it is a model whose coefficients someone acts on, it is the other one.
Where the two genuinely overlap
Analytic visualisations appear in the A00-470 objectives, which is the closest the reporting exam comes to modelling territory. They are treated as objects to place and configure, not as statistical procedures to justify, and that distinction is a reliable guide to how deep the questions go.
SAS’s own Visual Analytics product page is worth a look if the boundary still feels blurred, because it describes the reporting application rather than the modelling one.
How Should a Working Report Builder Prepare?
Audit your object range first. Most people who build SAS Visual Analytics reports for a living use perhaps half the object types the objectives name, because their organisation’s reporting style settled years ago. The fastest route to a pass is finding the untouched half rather than revising what you already do daily.
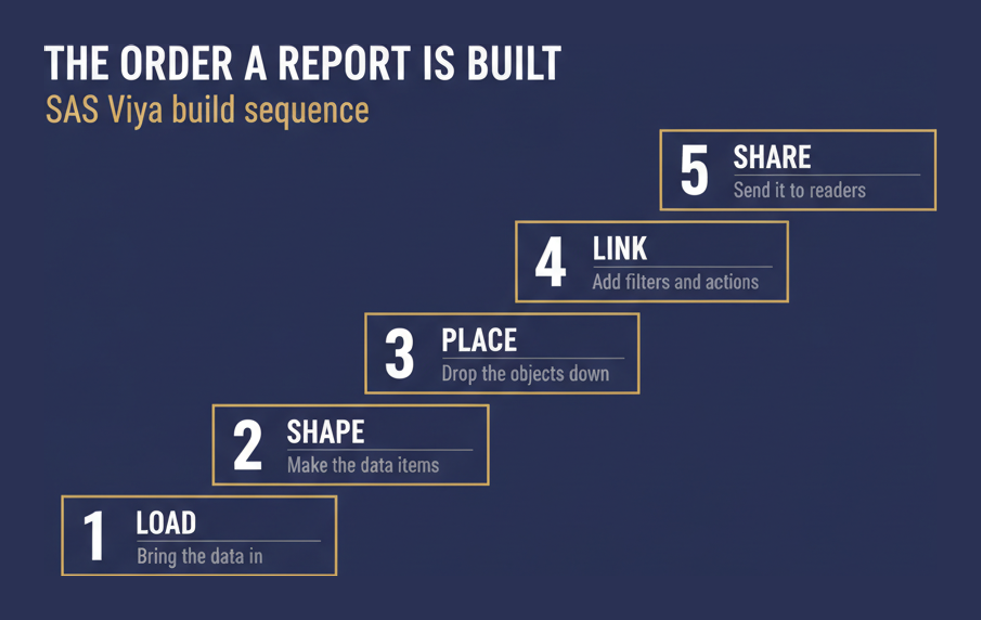
- Write out the named object list and mark every type you have not personally built in the last six months, since that list is your actual syllabus.
- Build one report containing every unfamiliar object type, however artificial the data, so the first time you configure a time variant chart is not during the exam.
- Practise data roles deliberately by rebuilding one familiar chart with the roles assigned wrongly, then correcting it, which fixes the distinction far faster than reading does.
- Work through parameters next, creating one of each of the numeric, character, date and expression-based kinds the objectives name separately.
- Spend a short session on the small third area, covering export, distribution and mobile viewing, because 8 to 10 percent is still five questions you can bank cheaply.
- Finish with timed practice at 55 questions in 100 minutes, treating any question that requires you to picture the interface as a signal to go back and build that object again.
The A00-470 exam hub collects the syllabus and practice material in one place, which is useful once your gap list exists.
On the career side, this credential tends to sit alongside business intelligence and reporting roles rather than data science ones. Published BI analyst salary ranges give a realistic band, and a certification moves you within it rather than out of it.
CertificationBox’s own A00-470 preparation page works as a checklist, and the wider SAS certification hub covers the neighbouring credentials.
Frequently Asked Questions
How many questions are on the A00-470 exam?
Between 50 and 55, depending on the form you sit, with 100 minutes to complete them. That works out at roughly two minutes per question.
What is the passing score for A00-470?
Sixty-seven percent. On a 55-question form that means around eighteen wrong answers is the limit, most of which you cannot afford to lose in the report-building area.
How much does the SAS Visual Analytics exam cost?
One hundred and eighty US dollars, delivered through Pearson VUE. That is at the lower end of enterprise analytics certifications, which makes it an accessible first SAS credential.
Which content area carries the most marks?
Use Objects and Build Reports, at 54 to 60 percent. Data Sources and Data Items follows at 32 to 36, and viewing, sharing and managing reports is only 8 to 10.
Do you need SAS programming to pass it?
No. A00-470 is an application exam covering the Visual Analytics interface on SAS Viya. Coding skill helps you understand calculations but is not what the questions assess.
Is A00-470 the same as the Visual Statistics exam?
No. Modeling Using SAS Visual Statistics is a separate credential about building statistical models. A00-470 is about building reports and the objects that make them up.
What is a common filter?
A filter applied across multiple objects rather than to a single one. Knowing when a filter should be common rather than local is a named subsetting skill in the objectives.
Why does SAS call it Visual Business Analytics?
SAS lists the credential as Visual Business Analytics Specialist while the exam itself is titled Visual Analytics Using SAS Viya. Both names refer to the same certification.
Are parameters really examined?
Yes, and in detail. The objectives name numeric, character, date and expression-based parameters separately, which suggests questions can distinguish between the four kinds.
How long should preparation take?
For a daily report builder, a few focused weeks spent on unfamiliar object types. For someone new to the interface, considerably longer, because more than half the paper is hands-on building.
Conclusion
A00-470 concentrates its marks in one place. Six questions in ten come from building objects and assembling them into a report, another three from getting the data into a usable shape, and barely one from everything that happens after the report is finished. Preparation should follow that shape exactly, and the most valuable hour you can spend is building an object type you have never used.
Treat the SAS Visual Analytics exam as a practical test of the application rather than a knowledge test about analytics. Audit your object range against the named list, close the gaps by building rather than reading, then rehearse against realistic practice material before booking.


