
Fail more than half the paper and you still pass. That is not a loophole in the Tableau Desktop Foundations exam, it is the published standard: Analytics-101 asks for 48 percent, which on a 40-question paper is 20 correct answers. Sit the same exam in Japanese and the bar rises to 55 percent. Fail either version and the retake costs nothing at all.
Those three facts change how this credential should be approached. A low bar with a free second attempt is an invitation to book early and treat the first sitting as reconnaissance, which is the opposite of how most certification advice reads. What the exam does expect is breadth: 40 questions spread across four weighted domains covering data connections, chart building, dashboards and the vocabulary Tableau uses for fields. This guide works through all four, converts the weights into question counts, and shows where a 20-mark target is easiest to reach.
Why Does the Tableau Desktop Foundations Exam Pass at 48 Percent?
Because Analytics-101 is an entry-level credential measuring whether you can operate Tableau Desktop at all, not whether you can do it expertly. Salesforce sets the English cut score at 48 percent and the Japanese cut score at 55 percent. On 40 scored questions, 48 percent means roughly 20 correct answers are enough to earn the certification.
Two things follow from that. The first is that no single domain can sink you. With 20 marks needed and 40 available, you can be genuinely weak in one area and still clear the bar comfortably on the other three. The second is that the exam is testing recognition rather than mastery, which is why the objectives are written as tasks you perform in the product rather than concepts you reason about.
The differing cut scores between language versions are worth noticing too. A pass mark that changes with the translation is a sign the standard was set per version rather than copied across, so the English paper’s lower bar is a property of that specific form.
What Are the Four Analytics-101 Domains?
Analytics-101 publishes four weighted domains. Exploring and Analyzing Data is the largest at 37 percent, followed by Sharing Insights at 25 percent, Connecting to and Preparing Data at 23 percent, and Understanding Tableau Concepts at 15 percent. Between them they cover the full path from a data source to a shared dashboard.
| Domain | Weight | What it covers |
|---|---|---|
| Exploring and Analyzing Data | 37% | Building basic charts, organising data with groups, sets, hierarchies and filters, and applying sorts, reference lines, table calculations, bins, calculated fields, parameters and totals |
| Sharing Insights | 25% | Formatting a view for presentation, building and modifying dashboards with interactivity and actions, creating stories, and viewing, exporting or publishing workbook data |
| Connecting to and Preparing Data | 23% | Live connections versus extracts, multi-connection data sources, relationships, joins and unions, and managing field properties such as aliases, geographic roles and data types |
| Understanding Tableau Concepts | 15% | Dimensions against measures, discrete against continuous fields, discrete date parts against continuous date values, and how aggregation behaves |
The ordering matters more than it looks. Three of the four domains are procedural, describing things you click and configure. Only the last one is conceptual, and it is the smallest. That balance is the clearest signal of what kind of exam this is.
How Many Questions Does Each Domain Get?
Applying the weights to 40 scored questions gives roughly 15 questions on exploring and analyzing, 10 on sharing insights, 9 on connecting and preparing data, and 6 on Tableau concepts. Against a target of 20 correct answers, the two largest domains alone supply 25 questions, which is more than enough to pass on their own.
| Domain | Weight | Approximate questions of 40 |
|---|---|---|
| Exploring and Analyzing Data | 37% | 15 |
| Sharing Insights | 25% | 10 |
| Connecting to and Preparing Data | 23% | 9 |
| Understanding Tableau Concepts | 15% | 6 |
Read that as a strategy rather than a licence to skip anything. Getting every question right in Exploring and Analyzing plus most of Sharing Insights clears 48 percent by itself, which tells you where the first three study sessions belong. Testing yourself against Analytics-101 exam material domain by domain is the fastest way to confirm those 25 questions are safe before worrying about the remaining 15.
What Is the Analytics-101 Exam Format?
Analytics-101 delivers 40 scored multiple-choice and multiple-select items in 70 minutes, with a registration fee of $75 US dollars and a free retake. Salesforce also includes up to five unscored questions on top of the 40, and adds no extra allowance for them, so plan the clock around 45 items rather than 40.
| Detail | Value |
|---|---|
| Exam name | Salesforce Tableau Desktop Foundations |
| Exam code | Analytics-101 |
| Scored questions | 40, plus up to five unscored |
| Duration | 70 minutes |
| Passing score | 48% in English, 55% in Japanese |
| Registration fee | $75 USD |
| Retake fee | Free |
| Prerequisites | None |
| Delivery | Proctored, at a test centre or online |
| Recommended training | Desktop I: Fundamentals |
Seventy minutes across 45 possible items is about 93 seconds each, and no reference material is permitted during the exam. Registration runs through Pearson VUE for Salesforce, and the full Salesforce exam guide publishes the same four weightings used above.
One more detail that separates this credential from the professional tier: Salesforce states there is no required maintenance for it. Once earned, it does not need renewing.
Charts You Have to Be Able to Build
The largest domain names nine chart types explicitly, and the list is worth learning as a checklist rather than a topic. Every one of them is a build task, phrased as something you produce rather than something you describe, which means practice in the product beats reading about it.
- Bar chart, line chart and scatterplot, the three that carry most of the questions
- A map built from geographic data, and a density map
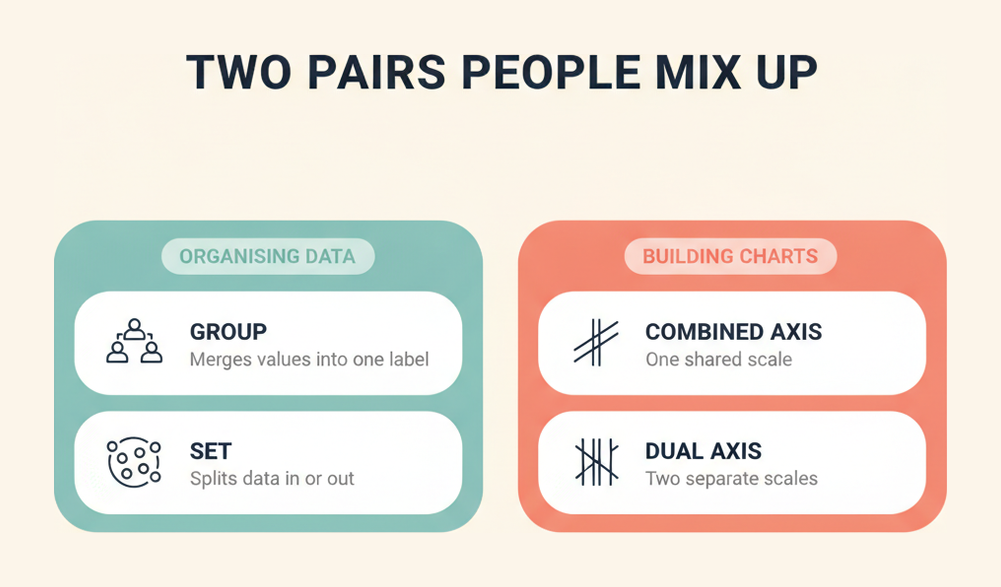
- A combined axis chart and a dual axis chart, which candidates routinely confuse
- A stacked bar
- A crosstab or highlight table, for showing specific values rather than shapes
Alongside the charts sit the organising tools: groups created from marks, headers or the data pane, sets created the same way, dimensions arranged into a hierarchy, and both ordinary and date filters. Then the analytics layer, which includes manual and computed sorts, reference lines, quick table calculations, bins and histograms, calculated fields, parameters and worksheet totals.
That is a long list for 15 questions, so depth is not the goal. Being able to say which menu produces which result, and what distinguishes a group from a set or a combined axis from a dual axis, covers most of what gets asked. The wider context on why particular chart forms suit particular comparisons is well covered in the data visualization overview if the vocabulary is new.
Where Do the Marks Hide in Connecting and Preparing Data?
In the distinctions rather than the mechanics. The 23 percent domain asks you to create live connections and extracts, explain the difference between them, save metadata properties in a .TDS file, and build a data source that uses multiple connections. Then it moves to the data model: relationships, joins, unions, and knowing when a join is right instead of a relationship.
The join-versus-relationship objective is the one that catches people. Relationships are the newer, looser way Tableau associates tables, and the exam asks you to explain when each is appropriate, not merely to create both. Anyone who learned Tableau before relationships existed tends to answer this from habit.
The rest of the domain is field housekeeping: renaming a field, giving a value an alias, assigning a geographic role, changing a field’s data type between number, date, string and Boolean, and changing default properties such as number format, aggregation, colour and date format. These are quick marks, and they are the cheapest nine questions on the paper to secure.
What Does Understanding Tableau Concepts Really Test?
Vocabulary, and specifically four pairs of ideas that Tableau treats as fundamental: dimensions against measures, discrete against continuous fields, discrete date parts against continuous date values, and how aggregation behaves by default. At 15 percent, or roughly six questions, it is the smallest domain and the only purely conceptual one.
The aggregation objective goes slightly further than the others. It asks you to explain the default aggregation for measures and to describe how an aggregated measure changes when dimensions are added to a view. That is a genuine reasoning question rather than a definition, and it is the single most useful idea in the whole syllabus for actually using the product.
Because the domain is small and self-contained, it is the best candidate for a final revision session. Six questions of pure vocabulary are worth more than a third of the marks needed to pass, and they can be secured in an afternoon.
How Does This Compare With the Tableau Data Analyst Exam?
Analytics-101 sits a full tier below Analytics-DA-201. The Foundations paper asks whether you can build a chart, a dashboard and a data connection. The Data Analyst credential asks whether you can make analytical judgements with those tools, and it carries the maintenance requirement that Foundations does not.
That gap shows in the objective verbs. Foundations objectives begin with “create”, “add”, “change” and “explain”. The higher-tier exam expects choices to be defended. If you already work in Tableau daily, Foundations may be too shallow to be worth the sitting, and the Tableau Data Analyst guide is the better place to start.
The full ladder, and where each credential sits relative to the others, is set out on the Tableau certification overview. Reading it before booking is worth ten minutes, because the entry tier and the professional tier answer different questions about a candidate.
Where Foundations genuinely earns its fee is as a first credential: no prerequisites, no maintenance, a $75 entry, a free retake and a 48 percent bar. For a career changer or an analyst who has used Tableau informally without ever proving it, that combination is hard to argue with.
How Should You Prepare for a Free-Retake Exam?
Differently from how you would prepare for one that charges again. A free retake turns the first attempt into the most accurate diagnostic available, so the efficient plan front-loads the two biggest domains, books early, and uses the result to aim the second half of study rather than trying to be complete first.
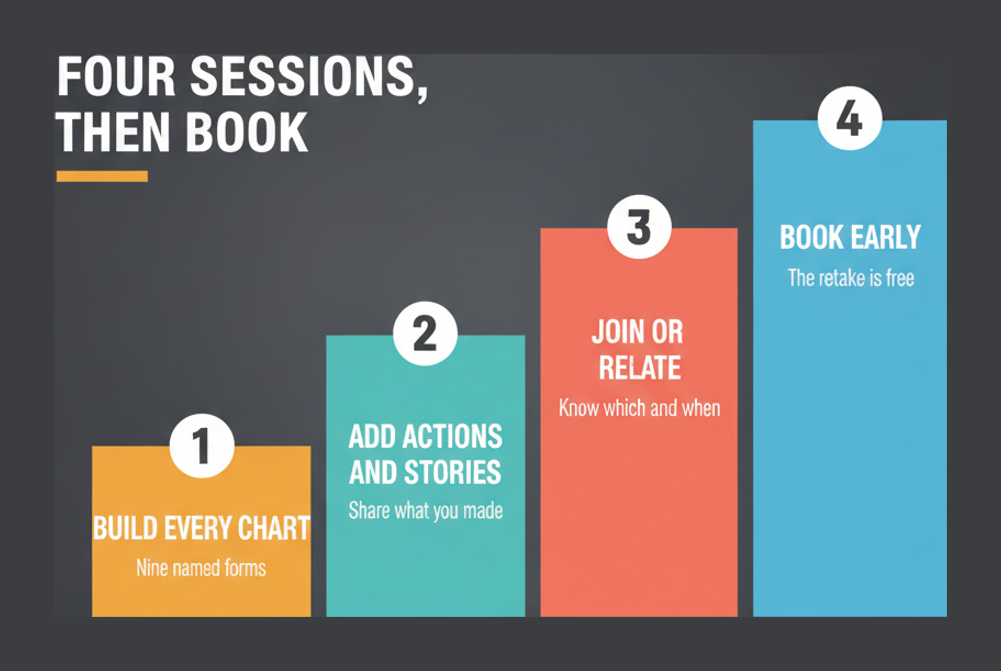
- Start with the nine named chart types and build every one of them yourself in Tableau Desktop, because the largest domain is written entirely as build tasks.
- Move to the organising and analytics tools in the same domain, focusing on the pairs candidates confuse: groups against sets, combined axis against dual axis, and quick table calculations against calculated fields.
- Cover Sharing Insights next, working through dashboard actions, device-specific layouts, stories and the export routes to PDF, image and Microsoft PowerPoint.
- Spend a session on the data domain, concentrating on when a relationship is correct instead of a join and on saving metadata properties into a .TDS file.
- Finish with the six-question concepts domain, which is pure vocabulary and can be secured in a single afternoon of revision.
- Book the exam once the two largest domains feel solid, and treat any gap the first attempt exposes as the syllabus for the free second sitting.
Three to four weeks of evening study is realistic for someone who has opened Tableau before, and six for a complete beginner working from the free how-to videos. If the aim is a longer Tableau path rather than a single certificate, the Tableau Architect route shows where the ladder eventually leads.
Frequently Asked Questions
What is the passing score for the Tableau Desktop Foundations exam?
Forty-eight percent for the English version and 55 percent for the Japanese version. On 40 scored questions, 48 percent works out at roughly 20 correct answers.
How many questions are on Analytics-101?
Forty scored questions, plus up to five unscored items that do not affect your result. The 70-minute limit covers all of them, so pace for 45 questions rather than 40.
How much does the Tableau Desktop Foundations certification cost?
Seventy-five US dollars to register, and the retake is free. That combination makes it one of the cheapest routes to a recognised Salesforce credential.
Does the Tableau Desktop Foundations credential expire?
No. Salesforce states there is no required maintenance for this certification, which distinguishes it from the professional-tier Tableau credentials that do need upkeep.
Are there prerequisites for Analytics-101?
None. The exam is aimed at people with foundational Tableau Desktop knowledge, and no earlier certification or formal training is required before booking.
Which domain carries the most marks?
Exploring and Analyzing Data at 37 percent, roughly 15 of the 40 questions. It covers chart building, grouping and filtering, and the worksheet analytics layer.
Can you use reference material during the exam?
No. Salesforce does not permit references during the exam, which is delivered proctored either at a test centre or in an online environment.
How is this different from Tableau Desktop Specialist?
Desktop Foundations is the current Salesforce entry-level Tableau credential with its own code, Analytics-101. Candidates searching for older Tableau exam names should confirm which credential is actually on offer before booking.
What chart types does the exam expect you to build?
Bar, line, scatterplot, map from geographic data, combined axis, dual axis, stacked bar, density map, and a crosstab or highlight table for showing specific values.
How long does preparation usually take?
Three to four weeks of evening study for someone who has used Tableau before, and around six weeks for a complete beginner working through the free how-to training videos.
Conclusion
Analytics-101 is unusual among certifications in being genuinely designed to be passable. Twenty correct answers out of 40, no prerequisites, no maintenance, a $75 fee and a free second attempt add up to a credential that rewards booking early rather than over-preparing. The four domains are heavily weighted toward things you do in the product, and the single conceptual domain is the smallest on the paper.
Build the nine named chart types by hand, get comfortable with dashboards and actions, learn when a relationship beats a join, and spend one clear afternoon on dimensions, measures, discrete and continuous fields and aggregation. Once those are in place, working through sample items domain by domain will tell you quickly whether the first attempt is worth booking or whether one more week is the better call.


